
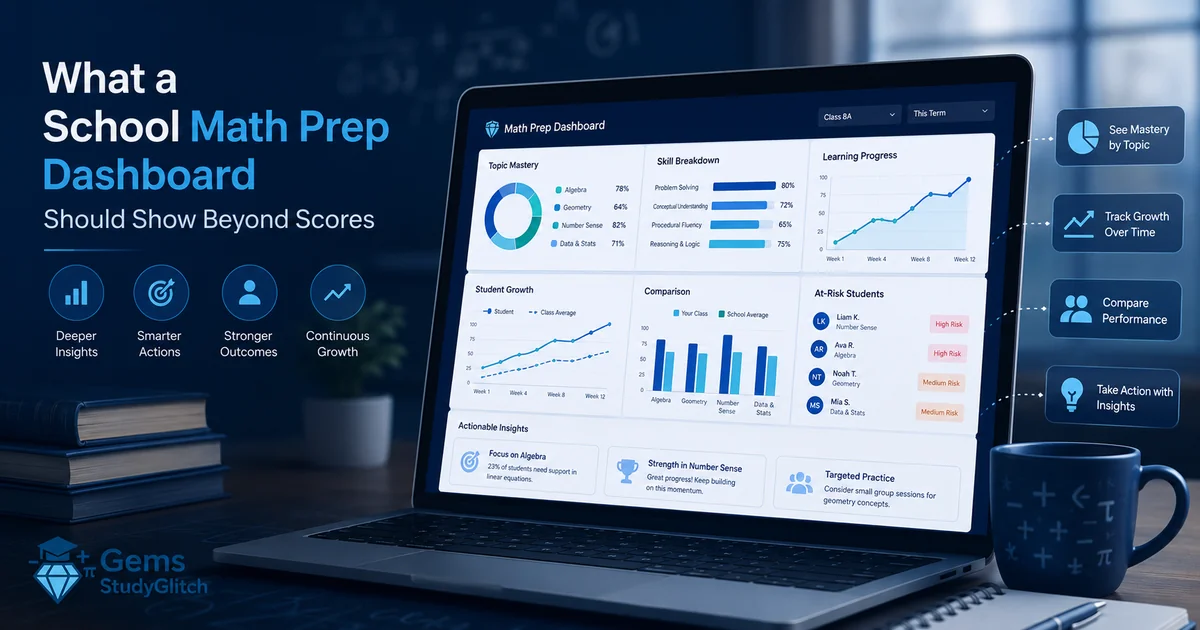
A school math-prep dashboard should do more than display scores.
Scores matter, but they are not enough. A score tells a school where a student ended. It does not always explain what happened during preparation, which topics caused difficulty, whether the student practiced consistently, or what should change next.
A useful dashboard should help schools understand the story behind the score.
Topic performance should be clear
Schools need to know which topics students are struggling with.
For SAT Math, that may include Algebra, Advanced Algebra, Statistics and Data Analysis, and Geometry and Trigonometry. For GAT Quantitative, it may include reasoning, ratios, arithmetic, geometry, and word-problem patterns. For AP Calculus AB, it may include limits, derivatives, integrals, applications, and FRQ reasoning.
A dashboard should make these weaknesses visible.
Without topic performance, schools only see the final score. With topic performance, schools can decide what needs reteaching, what needs practice, and what can move forward.
Skill clusters matter
A strong dashboard should not only show broad topics. It should also show repeated skill patterns.
For example, a student may not be weak in all algebra. The student may specifically struggle with equation setup, exponent rewriting, systems, or interpreting word problems.
This level of detail helps schools avoid vague recommendations.
Instead of saying the student needs more math practice, the dashboard can show which skill cluster needs attention.
Progress over time should be visible
One test result is only a snapshot.
Schools need to know whether students are improving after practice, tutoring, or materials. A dashboard should show progress over time so coordinators can see whether the plan is working.
If a student keeps practicing but the same weakness stays the same, the school may need to change the support strategy.
This is why a strong math progress report should show more than a final number. StudyGlitch explains this idea further in What a Good Math Progress Report Should Actually Show.
Engagement data helps schools act earlier
A dashboard should help schools identify active and inactive students.
If a student is not opening materials, not taking practice tests, or not completing assigned work, the issue may not be the topic alone. The issue may be engagement, accountability, or unclear next steps.
Schools should not discover this too late.
Engagement data allows coordinators to intervene before the final exam period. It helps schools support students while there is still time to adjust.
Timing behavior is important
Math prep is not only about knowing the content.
Students may understand a topic but still lose points because they run out of time, rush, skip steps, or spend too long on one question.
A dashboard should help schools notice timing behavior where possible. This is especially important for SAT Math and GAT Quantitative, where pacing and decision speed affect performance.
For AP Calculus AB, timing also matters because students must manage multiple-choice and free-response sections with different demands.
Diagnostic and practice data should connect
A strong dashboard should connect the student’s diagnostic result to later practice.
If the diagnostic shows weak algebra, the dashboard should help schools see whether algebra improved after materials, practice, or tutoring. If the diagnostic shows weak FRQ reasoning, the dashboard should show whether the student is improving in written calculus work.
Without this connection, diagnostics and practice feel separate.
The StudyGlitch diagnostic hub, materials page, and PowerCenter are designed to support a more connected learning path.
The dashboard should support decisions
A dashboard is only useful if it helps schools decide what to do next.
Should a student review foundations. Should a group receive targeted instruction. Should a student move into practice tests. Should a student receive tutoring. Should the school adjust the prep plan.
The dashboard should make these decisions easier, not more confusing.
This is why schools should use diagnostic data before prep begins. The article How Schools Can Use Diagnostic Data Before SAT, AP, or GAT Math Prep explains how schools can use readiness data before assigning support.
Reporting should be clear for coordinators and families
A school dashboard should be clear enough for coordinators, teachers, tutors, and families to understand.
Too much raw data can create confusion. Too little data can hide the real problem.
The best reporting shows what matters: score trend, weak topics, skill patterns, engagement, timing, and recommended next steps.
This connects with what schools and families often miss about math performance data.
StudyGlitch is built for clearer math prep reporting
StudyGlitch is a diagnostic-based math prep platform for SAT Math, GAT Quantitative, and AP Calculus AB.
It is built to connect readiness checks, practice, materials, tutoring, and reporting so schools can see more than isolated scores.
Schools can learn more about the platform on the About StudyGlitch page and explore how StudyGlitch supports structured prep for students and institutions.
Final thought
A score tells schools where students ended.
A strong math-prep dashboard shows what happened before that score and what should happen next.
That is the difference between reporting results and improving preparation.